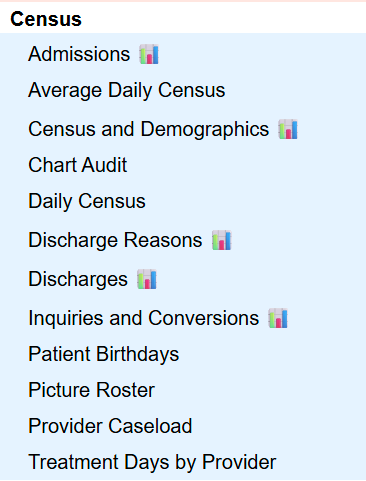
This article explains the purpose of each report available in the Census section of Reports and how these reports provide visibility into census data, admissions and discharges, demographic information, and population reporting.
Permissions Required
No specific BestNotes permissions are required.
Visual Tutorial
- BestNotes Reporting Tools Webinar: Census and Demographics (6:56)
- BestNotes Reporting Tools Webinar: Chart Audit (44:50)
- BestNotes Reporting Tools Webinar: Discharge Reasons (25:30)
- BestNotes Reporting Tools Webinar: Inquiries and Conversions (17:07)
- BestNotes Reporting Tools Webinar: Provider Caseload (28:50)
Understanding Census Reports
Admissions
The Admissions report displays how many clients were admitted and where they were referred from within a selected date range.
Key details
- Displays admission counts
- Includes referral source information
- Can be filtered by Date Range: Quarterly, Monthly, Yearly
Average Daily Census
The Average Daily Census report displays average census information over a selected period of time.
- Allows filtering by date and tag
- Displays client count in selected date window
- Shows admissions, discharges, total client days, average daily census, and Average length of stay (LOS)
Census and Demographics
The Census and Demographics report displays a census dashboard that includes a calendar census view along with demographic and summary charts, with optional client-level detail.
Key details
- Includes top diagnosis chart
- Includes age/sex bar chart
- Includes top payers chart
- “Show Details” displays additional client-level rows
- If “Show Details” box is selected the following information is displayed in addition to the visual graphs.
Chart Audit
The Chart Audit report displays a daily, calendar-style view of client activity.
Key details
- Displays a daily, calendar-like view of client activity
- Includes billed charges, appointments, progress notes, and program enrollment events
Daily Census
The Daily Census report displays all clients active within a selected date range, grouped by provider.
Key details
- Displays active clients within a date range
- Groups results by Access Tag
- Displays Clinician Case Load
Discharge Reasons
The Discharge Reasons report displays inactivation (discharge) reasons for clients.
Key details
- Displays discharge reason information
Discharges
The Discharges report displays how many clients were discharged and where they were referred from within a selected date range.
Key details
- Displays discharge counts by referral source
- Includes referral destination information
- Can be filtered by Date Range
Inquiries and Conversions
The Inquiries and Conversions report displays the number of inquiries with a qualified status during a selected time frame, grouped by referral category.
Key details
- Displays qualified inquiry counts
- Groups results by referral category
- Can be filtered by Date Range: Quarterly, Monthly, Yearly
- Custom Date Range
- Can be filtered by Tag
Patient Birthdays
The Patient Birthdays report displays patient birthdays grouped by month and can be generated for current or past contacts.
Key details
- This can be pulled for current or past contacts. Current contacts are those that have a Start Date/DOA but no End Date/DOD. Past clients have an entry in both Start and End Date.
Picture Roster
The Picture Roster report displays a list of current clients with pictures, listed alphabetically by last name.
Key details
- Displays current clients with photos
- Lists clients alphabetically by last name
- Can be filtered by Tags
- “Include Allergies” check box enables a visual view of patient allergy concerns
- Adding a patient photo “Edit photo” function is found in the patient chart, otherwise default image shown below
Provider Caseload
The Provider Caseload report displays clients assigned to each provider.
Key details
- Displays provider-to-client assignments
Treatment Days by Provider
The Treatment Days by Provider report displays providers, associated clients, and average length of stay (LOS) with summarization.
Key details
- Displays provider and client information
- Includes average length of stay (LOS) values