This article describes the default Custom and Library Reports available in BestNotes at startup. These reports are customizable and provide various summaries and detailed information across different areas of the application.
Permissions Required
- Ledger - Report All Providers
- Manage Ledger
- File Audit
- System Administrator
- DSM5-TR® Diagnosis
- Videra User permission
Understanding Default Custom and Library Reports
The following Custom and Library Reports are a set and given to all customers at startup. These reports are customizable. Many companies may have their own version of these reports. Report default description is given.
Custom Reports
Admissions/Discharges
Displays a monthly Admittance, Discharged, Average Length of Stay (LOS), and Retention Rate summary over a particular year. This report can be run by a census year. ADC = Average Daily Census. (Can be switched with Admission/Discharges by Location if a company is using locations).
Incident Reports / Reportable Group Notes
Displays information from the reportable group notes that have been filled out in the Group Notes area. For example, some companies may need to run this daily to report on what incidents happened the day before. It can be filtered by Date Range. This report displays: Date of Incident, Day of Week, Time of Incident, Time of Day of Incident, Duration of Incident, Duration Category, Number of Clients Involved, Type of Incident, Hospitalization Required?, Police Involved?, Severe AWOL, Person Completing Form, Date Report Completed, Names of Staff Involved, Maintenance Report Required?, Date Maintenance Report Completed, General Description of Events, Client Name, Stage, Description, Who Notified, When Notified, Notified by and Further Action Required?. This template and supporting report are often customized and so the questions listed may be different for your company.
Staff Pictures Roster
- If displayed and you are not using HR, submit a support ticket to have hidden.
- This report displays all staff photos, if they are entered into your account in the following ways:
- Individuals
- And have "HR" Access Tag.
Library Reports
Average Daily Census
Displays company census which includes: Client Count, Admissions, Discharges, Total Client Days and an average daily census.
- The report can be filtered by Date Range and Tag.

BestNotes Utilization
Displays primary BestNotes features and includes usage data by month.
Billing Authorizations
Displays active client payer authorizations by payer, provider, or tag.
Patient Payers
Displays active client insurance by payer and/or tag.
- Only displays clients with an active insurance setup in their Episode tab.
- The report can be filtered by Tag and by Payer (insurance companies listed in Settings -> Payers).
Insurance Billing
Simplified ledger report.
Business List
Displays a business with related contacts.
- Businesses can be filtered by State or Tag.
Calendar Reports
Appointment Forecasting
Displays appointments by type, date, time, and charge amount. This report forecasts charge information based on ledger codes linked to appointment types.
- The permission "Ledger All Providers" is required to display all appointments.
- Ledger must be checked for the client.
Appointment Status
Appointments grouped by contact or provider within a date range and associated encounter data.
- The report can be filtered by Date Range, Facility, Provider, Appointment Type, Status, and Tag.

- Ledger information.
- An asterisk (*) next to Time indicates it is a recurring appointment.
- Displays overlapped appointments in yellow, even across providers when grouped by contact.
Examples:
- Managing appointment confirmations for future appointment days.
- Reviewing number of 'no shows' during a particular date range or by provider.
- Monitoring payments collected by appointment date.

Appointment Time Durations
Displays the difference in days/hours/minutes between the times collected during the appointment workflow.
- The report can be filtered by Date Range, Facility, Provider, Appointment Type, and Status.

There are four time durations calculated:
- From Check-In time to Ready Time
- From Ready Time to Begin Time
- From Begin Time to Check-Out Time
- From Check-In Time to Check-Out Time
Depending on a user's workflow, different analysis can be obtained. For example, for an office where the provider checks in and checks out their own appointments, the best calculation for appointment duration would be the check-in to check-out. This is because if a provider checks-in their own appointments the check-in, ready and begin timestamps will all be the same. Therefore, only one true duration is calculated; the Check-In to Check-Out.
However, if an office has a front desk staff member that checks the appointment in. Then perhaps the client is marked not ready indicating other services/work is to be done before the appointment begins (i.e. intake paperwork, x-rays, etc.). Finally the appointment is begun by the provider and checked-out by front-desk staff as the client leaves. In this case, all four time durations may be of interest for analysis.

'Check-In' time - when 'Check-In' is selected from any of these areas.

'Ready' time - this will be the same time as the Check-In time unless 'Client Not Ready' is selected. Client Not Ready is available after an appointment is checked-in.

'Begin' time - when the 'Begin' is selected. *If a provider checks-in their own appointments the 'Check-In', 'Ready' and 'Begin' will all have the same timestamps.
Why isn't there a begin timestamp in my report?
There are 2 workflows where, by design, this is the case:
1) An office member (other than the appointment provider) checks-in the appointment, this creates the document in the client activity log. The provider then opens and completes the documentation from the activity log and checks-out the appointment.
2) On an appointment that does not have a template associated with it, an office member (other than the appointment provider) checks-in and checks-out the appointment.
Why are some wait times blank and others say '0 min'?
If both timestamps are the exact same, '0 min' will display.
If either of the timestamps are missing the difference calculation will be blank.
How are the average times calculated at the top of the report?
For every entry where the time difference is not blank and greater than 0 min, the time difference is included.
For example:
#1 - Check-In to Check-Out : 30 min
#2 - Check-In to Check-Out: 40 min
#3 - Check-In to Check-Out: 0 min
Average: 35 min (30+40/2)
Schedule by Day
Desk calendar view of provider schedule, one column for each day.
Patients Without Future Appointment
Displays active contacts that have been seen before with no future appointment scheduled.
Appointment Settings
Displays a single view of the Appointment Types created in calendar settings.
Provider Caseload
Displays clients assigned to each provider.
- The report can be filtered by status (inquiry, admits) and by date range.

- Requires the "Administrator" User Type.
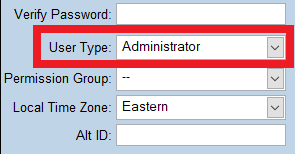
- Requires the "Administrator" User Type.
Patient Allergies
Displays clients with food, drug or environment allergies list.
- The report can be filtered by Client Status, Tag, and Allergy Type.
Patient Birthdays
Displays patient birthdays grouped by month.
- This can be pulled for current or past contacts. Current contacts are those that have a Start Date/DOA but no End Date/DOD. Past clients have an entry in both Start and End Date.
Chart Audit
Displays a daily, calendar-like view of all client activity.
- The report can be filtered by Facility, Provider, and Tag.
- This includes billed charges, appointments, progress notes, and program enrollment events.
Picture Roster
Displays a list of current clients with pictures.
- Current is defined as those with an admit date (DOA) and no discharge date (DOD).
- Clients are listed in alphabetical order by last name.
- The report can be filtered by Tags.
Patient Test Results
Displays manually entered lab/test results.
Patient Vitals
Displays vitals entered by date.
Consent Status
Displays all patient consents, including the authorized recipient, purpose of release, and expiration date.
Ledger Balances
Displays overall client ledger balance with the ability to filter for client credit or client due amounts.
- Displays balance as seen on the client register tab.
- The report can be filtered by Facility and balance type. The balance type options are 'Client Owing' (positive balance in register), 'Client Credit' (negative balance in register), 'Non-Zero Balances' and 'All'.
- The report is titled 'Ledger Balances' and not client as it looks at all contact types in BestNotes. Ledger items can be applied to non-client type contacts.
User Pending Signatures
Displays the number of notes that need to be signed by contacts.
- The report can be filtered by Tags.
Daily Census
Displays all clients active in a date range grouped by provider.
Diagnosis Summary
Displays client diagnosis and problem list filtered by client status in a date range or current tag assignment.
Duplicate Patients
Displays possible client duplicates.
Discharge Reasons
Displays inactivation (discharge) reasons for all clients.
- The report can be filtered by Tag and Date Range.
Incident Reports
Displays patient incidents tracked in a group note template displaying date/time of the incident, staff involved, etc.
- The report can be filtered by Date Range and Tags.
Treatment Days by Provider
Displays Provider, Clients, Avg Length of Stay (LOS) with summarization.
Ledger Settings
Displays a review of ledger settings and ledger configuration details.
- The Manage Ledger permission is required.
- Includes all Ledger Items/Codes created in BestNotes.
- The report can be filtered by Category.
- The report is sorted by Category and grouped by Procedural Codes.
Log Frequency by Contact
Displays a count of documents per contact.
- Also displays the amount of locked documents per Log Type for each contact.
- Change "Fields to Display" as needed.
- The report can be filtered by Date Type (Active Between, DOA, DOD, Contact Date), Tags, and Log Type.
Log Review
Report that allows extensive filtering to display patient documentation with staff and patient signature status.
This report is useful for managing documentation that must be completed within a particular time frame. Select a date type and a date range to filter documentation. The User filter will default to the user currently logged in. When displaying documentation for All Users, All Log Types a maximum date range of 1 week can be selected.
- For example, your business requires document ABC to be completed within 7 days after a patient's arrival. The report selection would be: Admit Date, Weekly date range, and ABC log type. This will display all clients that have a start date (DOA) in that date range and the status of the ABC documentation for that client.
- Data / Results can further be filtered by: Tags and Log/Template Type.
All Users vs. single User selection
- All Users – Documents for given log date range will display signature requirements for all users and will be grouped by log status' of Unlocked, Locked and Audited (green checkmark).
- Single User – The date range can be extended up to 1 month. The report will pull all documents created by this user and/or documents requiring their signature. The logs will be grouped by this users' signature status: Unlocked, Locked (no signature), Locked/Finalized (with signature).
The "Created On" column is only populated with information when the user running the report has the "File Audit" permission.
Log Status
Displays documents that meet the criteria selected.
- The report can be filtered by Date Range, Indicator (Off, On, All), Status (Unlocked, Locked, Audited, All) and Type (client, individual, business, program, all).
Med Clinical Field Data
Displays all data points from Med/Clinical assessments and treatment plans.
- The report can be filtered by Date Type and Range, Med/Clinical Tab, and Tags.
Med Clinical Table Data
Displays all table data points from Med/Clinical tables.
- The report can be filtered by: Table (Current medications, Allergy, etc.) and Date Range.
- This report can be displayed for screen or as a format that is better for exporting.
Patient Medications
Displays medications listed by client.
- The report can be filtered by Med Date Filter (Med Start Date between, End dates between, Med dates between, Refill date between), Date Range, Med Status (Active, Completed, Erroneous, Discontinued), and Tags.
- It can display the expanded view and last reviewed date as well.
Program / Episode Reports
Adm/Trans/Dis by Program
Displays all client program admissions, transfers, and discharges for a given date range.
- The report can be filtered by Report Type, Date Range, Program, Location, and Demographic.
Billing Authorizations by Program
Displays payer authorizations for all clients active in a program.
- The report can be filtered by Payer, Program, and Location.
At a glance, this report show all authorizations per client.
- Blue - Authorization has expired
- Green = Authorization is current
- Orange = displays clients recently discharged from a program (last 7 days)
Our recommended workflow, would be to inactivate an authorization once all charges have been billed and documentation is complete. This way it will fall off of the report.
Census Count Day/Mo/Yr by Program
Displays a program's census by Date Range.
- Any date range less than 30 days will display the census for each day. A date range greater than 30 days but less than one year will display the census by month and anything greater than that will display the census by year.
- The census is a grand total of all clients with a start and end date (from the edit client screen) within the date range selected.
- Admissions, Discharges, and No Programs are based on Active clients' Episodes (Programs, Level of Care, Transfers). If a program has Locations, client names per location display below.
Single Day Census by Program
Displays the daily census for all programs.
- The report can be filtered by Date, Programs, and Locations.
- It can include the report information from data forms (up to 2).
Patient Diagnosis by Program
Displays all client diagnoses as well as a count of the Top 5 Diagnoses.
- The report can be filtered by Date Range, Program, and Location.
Inquiries by Program
Displays the number of inquiries with qualified status by program enrollment.
- The report can be filtered by Date Range and Programs.
Log Review by Program
Displays active program participants and documentation completed.
- The report can be filtered by Date Range, Program, Location, and Provider.
- It can be further filtered by Log Type, Tag, and Fields to Display.
Example:
- Managers can check to make sure each active client is receiving an Activity Log on schedule.
Census by Program
Displays Program demographics: clients by program or programs by client.
- The report can be filtered by Date Range and Type, Program, Location, and Tag.
- It can include additional dynamic demographic information and/or data form fields (2).
Provider Caseload by Program
Displays each provider's caseload of active clients within a date range.
- The report can be filtered by Date Range, Provider Type, Program, and Location.
- It will display all client's providers through assignment in the Episode/Program tab as Staff. If no provider is assigned (in program tab) this report will display providers as assigned at the client level in the provider selections.
Census Summaries by Program
Displays client program census with summary by gender, age and summarizing total and avg daily census.
Visual Tutorial
Overview of BestNotes Reports
Parent Emails
Displays the preferred email of a parent (if selected). This report has been removed; use the Alternative Report - Related Contacts by Tag instead.
- The report can be filtered by Date Range.
- Parents shown have been marked with “PG” on the relationship.
Portal Accounts
Displays portal accounts that have been created, showing the name and email of portal users.
- The report can be filtered by Date Type and Range, Tag, and whether or not to search by linked contacts only.
- The report can also be searched by keyword.
Referral by Source
Displays all Referrals including Inquiries. This report has been removed; use the Alternative Report - Related Contacts by Tag instead.
- The report can be filtered by client Start Date (Admits) or client contact date (Inquires) for a selected date range, Referrer, and Referral Category.
- This report can be displayed for screen or as a format that is better for exporting.
Referred Out – Admits
Displays any admits that were referred elsewhere. This report has been removed; use the Alternative Report - Related Contacts by Tag instead.
- The report can be sorted by Date Range.
Referred Out – Inquiries
Displays all inquiries that were referred elsewhere. This report has been removed; use the Alternative Report - Related Contacts by Tag instead.
- The report can be sorted by Date Range.
Referred Out by Source
Displays admits that were referred to a specific source. This report has been removed; use the Alternative Report - Related Contacts by Tag instead.
- The report can be filtered by: Referrer and Date Range.
- This report can be displayed for screen or as a format that is better for exporting.
Referrer Counts
Displays a count of referrals by month/year. This report has been removed; use the Alternative Report - Referrer Statistics instead.
- The report can be filtered by Date Type and Range.
- A referrer is included if they were added as a pREF relationship on another contact (client).
Referrer Statistics
Displays the number of clients referred in a given date range and their statistics.
- The report can be filtered by Facility, Date Range, and Order By (alphabetical, referral count).
Referrers List
Displays all primary referrers in the system and the clients that they referred to your company.
Related Contacts
Displays clients with their related contacts, showing the related demographics as well as relationship type.
- The report can be filtered by Date Type and Range, Provider, Contact Type, Contact Tag, Relationship (exists/missing), Relationship Type, Related Contact Tag.
- Additionally, the report can be searched by keyword and ordered by contact or related contact.
- This report can be displayed for screen or as a format that is better for exporting.
Tag History
Displays an audit of contact tag add and remove actions and the staff that completed them.
- The report can be filtered by name (contact name or tag name) and date range.
Examples:
- To see all contacts that had a tag with 'current' in the name during a month.
- To see all tag history for all contacts by the last name.
- To filter the last result set down even more to answer the question: show me all contacts by name and the tags they had assigned in.
- Top Admitted/Inquiry referral sources.
Top Referrers
Displays Top Admitted/Inquiry referral sources. This report has been removed; use the Alternative Report - Referrer Statistics instead.
- The report can be filtered by Client (Admits/Inquiries), Date Range, and Tag.
- This report can be displayed for screen or as a format that is better for exporting.
Users Reports
Only System Administrators can run these reports.
User Login/Logout Audit Log
Displays an audit of user login and logout times with IP/Port information.
- The report can be filtered by Date Range, User, and Platform.
User Billing List
Displays all users included in the previous month's bill OR a preview of users that will be billed.
- Non-Billable Users can be hidden from the report.
- Users in the Billable Users area will be grouped by: Admin, Regular and Restricted.
- Users in the Non-Billable area will be grouped by: Calendar Resource, Billing Resource, and Non-Billable.
- The 'Pre-Billing' checkbox will change the dates of the report billing period to be reviewed.
- Each user's name will be displayed.
- Inactive users will display in red followed by the last time they logged in during the billing period listed at the top of the report.
- If the user has the DSM5 permission, the word "DSM5" will appear in blue.
- If the user has the Videra User permission, the word "Videra" will appear in blue.
- If the user's name appears with no date following their name it indicates they are currently an active user that has not logged in during the billing period.
- All active users, plus any inactive users that logged in during the billing period, will be charged.
- It is a good idea to review this report and inactivate users that are not using the system.
User Groups
Displays all users in groups.
- User groups restrict access to specific areas of BestNotes; this shows all groups and the users in those groups.
- The report can be shown by group or user.
User Details
Displays a user list showing first and last login date/time, password last updated, and 2FA enabled.
- Inactive Users can be hidden from the report.
User Permissions
Displays all users with specific permissions.
- The report can be filtered by User Permission and User Group.
- It will sort active users from inactive users.
User Provider Detail
Displays a list of providers by assignment type or setup.
- The Show by Provider Type option shows provider assignments (provider 1-4).
- The Show Provider Setup option lists each provider with specific details provided (i.e., NPI, State License, etc.).
Pricing
For detailed pricing information regarding BestNotes features and user types, please visit https://www.bestnotes.com/pricing.
Next Steps
- See also: Incident Reports
- See also: Calendar Documentation (General)
- See also: Appointment Statuses
- See also: Appointment Settings Documentation
- See also: Add a Profile Picture
- See also: Register/Ledger Tab Video
- See also: User Pending Signatures Documentation
- See also: DSM-5: Filling Out the Diagnosis Videos
- See also: Duplicate Patients Documentation
- See also: Discharge Reasons Documentation
- See also: Med/Clinical Documentation
- See also: Medications Video
- See also: Programs / Episodes Documentation
- See also: Episode Level of Care Payers (Authorizations)
- See also: Bed Tracking Documentation
- See also: Manage Ledger and Setup
- See also: Related Contacts Video Documentation
- See also: Users Documentation
- See also: User Groups Documentation
- See also: All User Permissions Documentation
This article provides an overview of various default, custom, and library reports available in BestNotes, detailing their purpose, filtering options, and specific use cases. It also covers user-related reports, including login audits, billing information, user groups, and permissions.
Back to top of page